Using Haptics to Convey Cause and Effect Relations in Climate Visualization
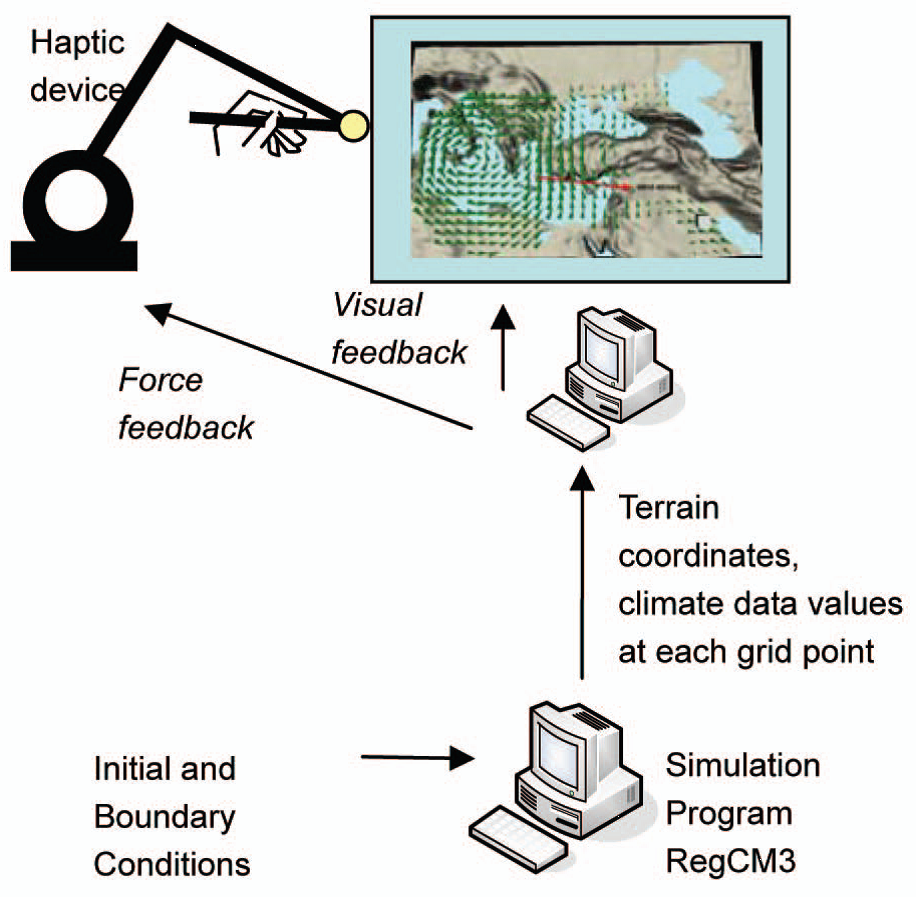
We investigate the potential role of haptics in augmenting the visualization of climate data. In existing approaches to climate visualization, dimensions of climate data such as temperature, humidity, wind, precipitation, and cloud water are typically represented using different visual markers and dimensions such as color, size, intensity, and orientation. Since the numbers of dimensions in climate data are large and climate data need to be represented in connection with the topography, purely visual representations typically overwhelm users. Rather than overloading the visual channel, we investigate an alternative approach in which some of the climate information is displayed through the haptic channel in order to alleviate the perceptual and cognitive load of the user. In this approach, haptic feedback is further used to provide guidance while exploring climate data in order to enable natural and intuitive learning of cause-and-effect relationships between climate variables.
Our work appeared in NewScientist magazine (Whether map interface lets you feel the wind), several internet-based news portals around the world, a local newspaper (Hurriyet, March 07, 2008) and a TV Channel (NTV-MSNBC).
Haptic Interaction for Molecular Docking in Virtual Environments
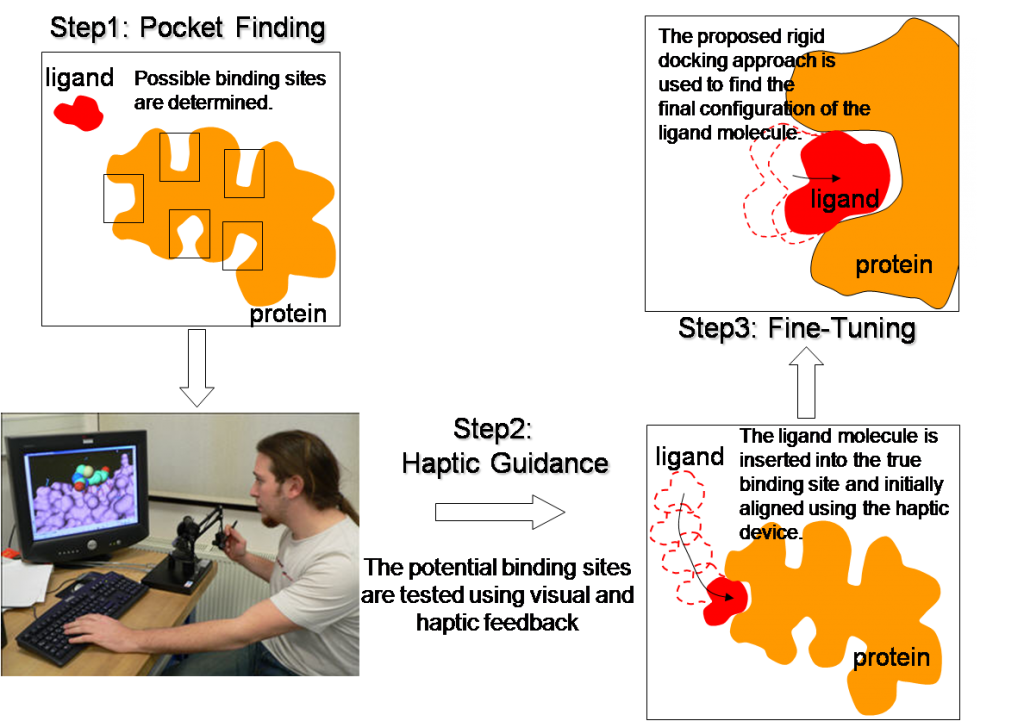
Many biological activities take place through the physicochemical interaction of two molecules. This interaction occurs when one of the molecules finds a suitable location on the surface of the other for binding. This process is known as molecular docking and it has applications to drug design. If we can determine which drug molecule binds to a particular protein and how the protein interacts with the bonded molecule, we can possibly enhance or inhibit its activities. This information, in turn, can be used to develop new drugs that are more effective against diseases. We propose a new approach based on human-computer interaction paradigm for the solution of rigid-body molecular docking problem. In our approach, a rigid ligand molecule (i.e. drug) manipulated by the user is inserted into the cavities of a rigid protein molecule to search for the binding cavity while the molecular interaction forces are conveyed to the user via a haptic device for guidance. Once the binding cavity is discovered, the computer takes over the control and fine-tunes the alignment of the molecule inside the cavity.

Robust and Efficient Rigid-Body Registration of Overlapping 3D Point Clouds
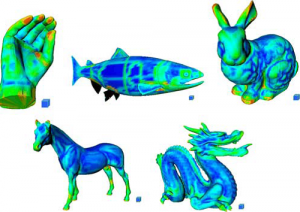
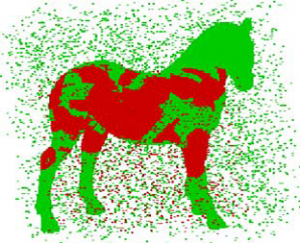
We propose a new feature-based registration method for rigid body alignment of overlapping point clouds (PCs) efficiently under the influence of noise and outliers. The proposed registration method is independent of the initial position and orientation of PCs, and no assumption is necessary about their underlying geometry. In the process, we define a simple and efficient geometric descriptor, a novel k-NN search algorithm that outperforms most of the existing nearest neighbor search algorithms used for the same task, and a new algorithm to find the corresponding points in PCs based on the invariance of Euclidian distance under rigid-body transformation.


Autostereoscopic and Haptic Visualization of Martian Rocks in Virtual Environments
A planetary rover acquires a large collection of images while exploring its surrounding environment. If these images were merged together at the rover site to reconstruct a 3D representation of the rover’s environment using its on-board resources, more information could potentially be transmitted to Earth in a compact manner. However, construction of a 3D model from multiple views is a highly challenging task to accomplish even for the new generation rovers. Moreover, low transmission rates and communication intervals between Earth and Mars make the transmission of any data more difficult. We propose a robust and computationally efficient method for progressive transmission of multi-resolution 3D models of Martian rocks and soil reconstructed from a series of stereo images. For visualization of these models on Earth, we have developed a new multimodal visualization setup that integrates vision and touch. Our scheme for 3D reconstruction of Martian rocks from 2D images for visualization on Earth involves four main steps: a) acquisition of scans: depth maps are generated from stereo images, b) integration of scans: the scans are correctly positioned and oriented with respect to each other and fused to construct a 3D volumetric representation of the rocks using an octree, c) transmission: the volumetric data is encoded and progressively transmitted to Earth, d) visualization: a surface model is reconstructed from the transmitted data on Earth and displayed to a user through a new autostereoscopic visualization table and a haptic device for providing touch feedback.

